If you watch the news, the economy can feel unpredictable. But if you look at the actual sales data for our local real estate market, you’ll see something surprising: Stability.
I spent this morning analyzing the last 3 years of local market trends, and I realized that for the last 36 months, our market has followed a strict schedule—almost like clockwork.
We don't see chaos. We don't see a bubble. We see a rhythm.
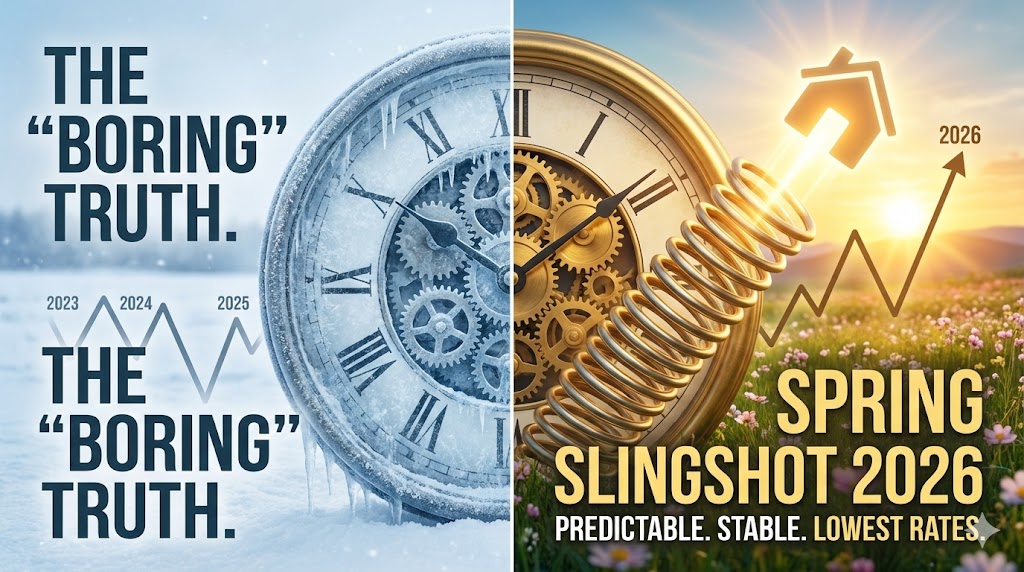
Part 1: The "Spring Slingshot" (Demand)
First, let’s look at Pending Sales. This represents buyer demand.
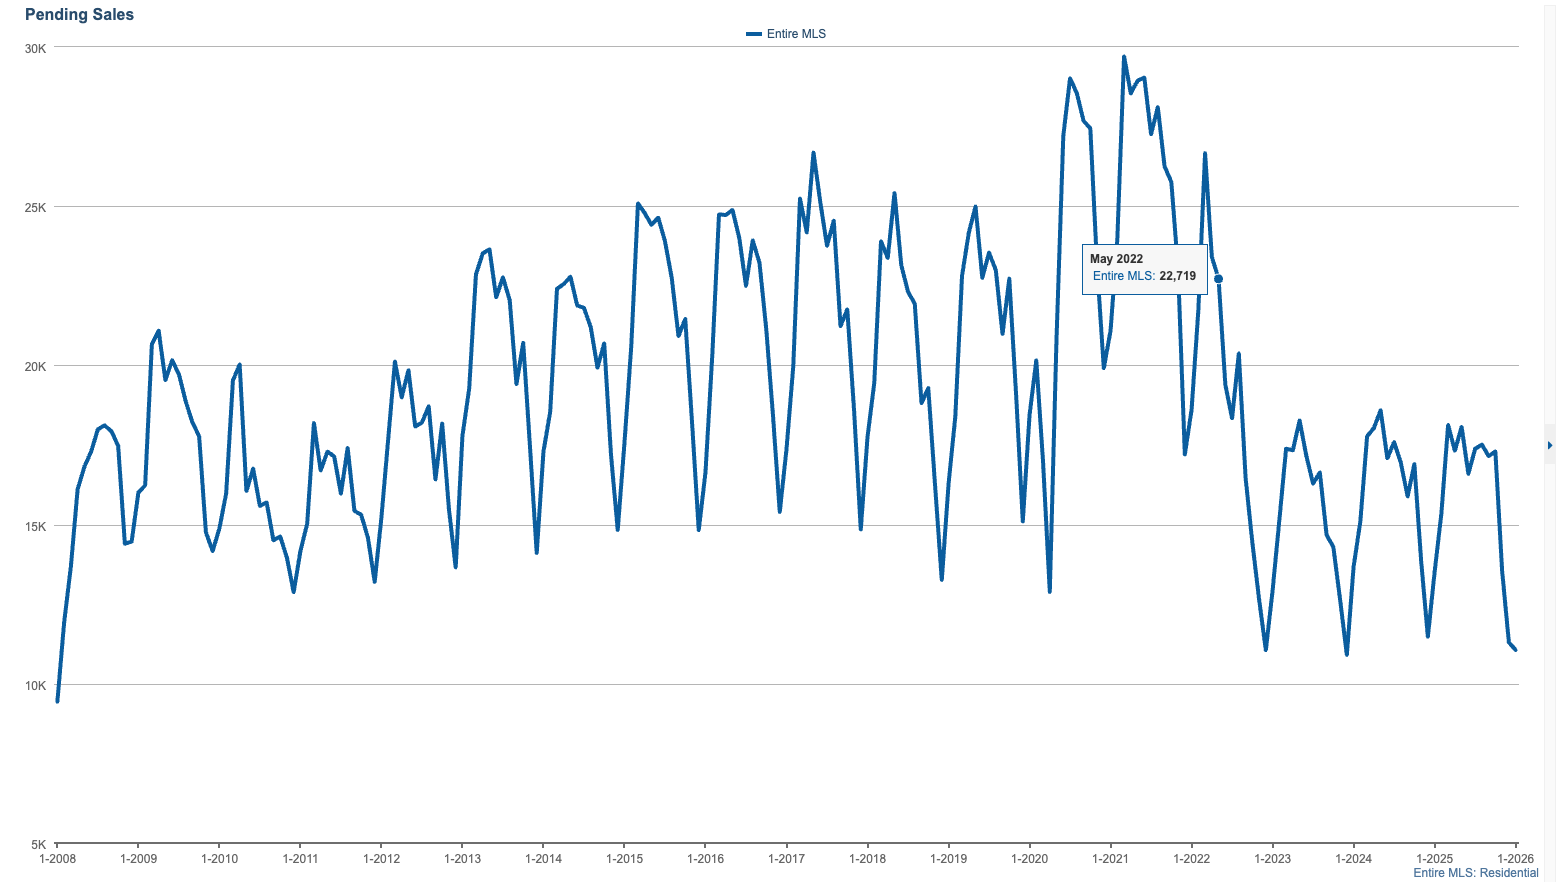
If you look at the blue line for 2023, 2024, and 2025, you will see the exact same pattern:
The Winter Dip: Every year, the market takes a deep breath in January and February. Activity slows down to the exact same "floor."
The Spring Slingshot: Then, without fail, the market wakes up in March. The line shoots vertically.
The "Identical" Phenomenon Here is the most striking part: It’s not just the timing that is identical; it is the volume.
Look closely at the last 3 years on the chart. The "Valleys" (the lows in January) all dip to nearly the exact same level. The "Peaks" (the highs in Spring) all rise to nearly the exact same height.
This proves the market isn't volatile; it's consistent. We hit the same lows and the same highs, year after year.
But Here is the X-Factor for 2026 While the pattern is identical, the conditions are not.
The surges we saw in 2023, 2024, and 2025 happened despite higher interest rates. We are entering the 2026 spring market with the lowest interest rates in 3 years.
What does this mean for demand? If the market surged vertically during years when money was expensive, imagine what the demand will look like now that money is "on sale."
We predict that the "Spring Slingshot" won't just repeat; it will be amplified. We are likely looking at a demand curve that doesn't just match the previous peaks, but potentially shatters them.
Part 2: The Inventory Trap (Supply)
This is where most buyers get stuck. They ask, "Shouldn't I wait until Spring when there are more houses for sale?"
To answer that, I pulled the Active Listings chart.
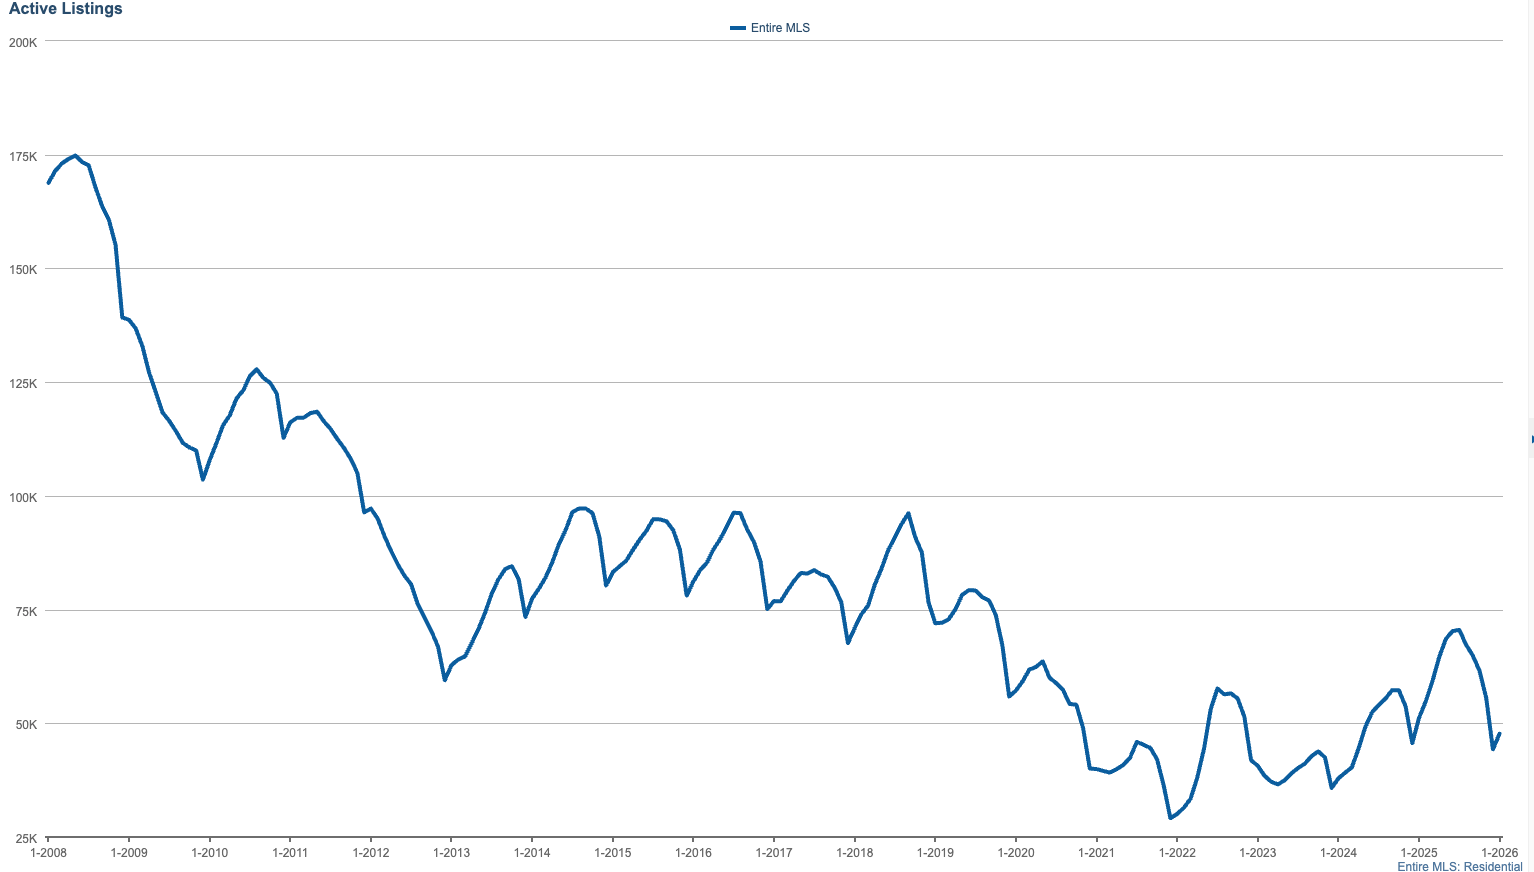
Just like the sales chart, the supply chart is stable and predictable. Inventory hits its absolute lowest point in winter and slowly rises in the spring.
Here is the trap: While it is true that inventory rises in the spring, look back at the Pending Sales chart. Buyer demand rises significantly faster.
If you wait for "more options" in April, you will find them—but you will likely find 5 to 10 other buyers bidding on them alongside you.
The Strategic Playbook: What You Should Do Now
Based on this data, here is our specific advice for every type of client in this market.
🎯 For BUYERS: The "Early Bird" Strategy
The Goal: Buy in the "Quiet Zone."
You might be tempted to wait until April for more options. But the charts show that waiting puts you in the middle of the traffic jam.
The Move: Secure a home now.
The Why: Right now, in February, demand is at its seasonal floor. You can tour homes without fighting a crowd. Lock in the low rate and the purchase price before the Spring competition drives values up.
Available Now: We have 7 exclusive listings ready for you to tour immediately.
🏡 For SELLERS: The "Scarcity" Advantage
The Goal: Be the only game in town.
The most common mistake sellers make is waiting until the flowers bloom to list their home. Look at the Active Listings chart—inventory is at rock bottom right now.
The Move: List your home ASAP.
The Why: If you list today, you are one of the only homes on the market. If you wait until May, you will be listing alongside everyone else and become a commodity. By listing now, you catch the very beginning of the "Spring Slingshot" in demand, but you do it while inventory is still scarce.
Want a valuation based on 2026 demand? Click Here
🔄 For MOVERS (Buying & Selling): The "Thread the Needle"
The Goal: Sell High, Buy Smart.
If you are selling your current home to buy a new one, this market is uniquely set up for you—if you move fast.
The Move: Sell for Scarcity, Buy for Rate.
The Why: List your home to capitalize on the low inventory levels. Then, use the proceeds to buy your next home now, locking in the lowest rates since 2022 before prices jump in the Spring rush.
The Bottom Line
Stability is the ultimate luxury. It means we don't have to guess.
The charts say the market is about to wake up. The rates say it's time to move.
Contact us today at 909-610-5188 to strategize your Spring 2026 plans.
Check out this article next