We are approaching the middle of the year and it is a good time to assess how is the real estate market doing so far this year. Is the market better than last year? or is it worth? We have to look at it from two angles: Price and Supply vs Demand.
Pending Sales (Demand)
Demand of housing is always and will always tie to mortgage interest rate. When interest rate is high, buyer’s payment is higher and less people can afford housing. Vice Versa, when mortgage rate drops, buyer’s monthly payment decrease. Housing essentially becomes less expensive so more people enter the market.
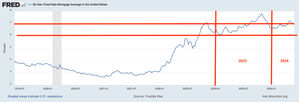
For the graph below you can see, interest rate first half of 2023 were well below 7% and its hovering around 7% in 2024 for the most parts. So buying a home is definitely more expensive. Demand of housing is indicated by numbers of pending sales. Logically we see a drop in demand from 18,326 to 13,928 down 24% year over year. We have less people buying this May compare to May of lasts year.

Active Inventory (Supply)
We are actually seeing more homes for sale this year. There were 43,541 Homes on the market for sale in May 2024 compare to 36,075 in 2023 – a 17.15% increase. So there more homes for buyers to choose from.
Supply and Demand
After you look at supply and demand together. There is no doubt that housing market is softer compare to May of last year. We saw more inventory on the market for buyers to select from but there are less buyers on the market. We are seeing a movement of moving from a hot sellers market towards a neutral market. When you have less than 6 month inventory, you are in the range of a sellers market. When you have inventory above 6%, you have a buyers market. While we are still in a hot sellers market, it is definitely trending towards a slight sellers market (between 4-6 month of inventory).
Price
Median sales price for May 2023 was at $780,000 for our entire MLS. It is is up to $865,000 in May 2024 for a 11% increase. Homes that were well priced and in a good condition were still getting multiple offers, sometimes even 10+. Median listing to sold price ratio stay at 100% – meaning 50% of the homes were sold above asking price and 50% of the home sold were below asking price.
So if the market is softening. Why did the price continue to grow? Key thing most people don’t realize is that price is a indicator of the market condition from 2-3 month ago when the sales contract was signed. We were seeing less inventory and more demand earlier part of the year. Another reason being that buyers on the market are very motivated. Most people, when they can, would probably hold off buying in a high mortgage rate environment. If people are buying now? They are going through some major life changing events and they have to buy. There are still more buyers than sellers and that’s why they were willing to bid to get the property they need.
In Conclusion
We are still in a strong seller’s market but are already seeing signs of softening. We know that 7% usually is a breaking point for buyers at the price today. When interest rate goes above 7%, demand drop noticeably. Should the interest rate remained the same, we can expect the market continue to softens. The consensus is that interset will start dropping 2nd half of the year but no one will be able to tell you exactly when. It depends heavily on the release of the economic data.
What it means for Buyers
It may be the perfect time to get in the market. Take advantage of the market softening will make it easier to get into a property with less bidding wars. With interest rate expected to drop second half of the year, you will get to refinance the property sooner.
What it means for Seller
Yes, we are still in a strong seller’s market ‘territory’ but have been moving towards a slight Seller’s market with inventory building and demand softening. When you price the property right according to the condition and the comparable, you will likely still get multiple offers. Don’t be greedy and price the property correctly. With market softening, you may easily see it stays on the market longer.


