Los Angeles County Real Estate Market Update — April 2026
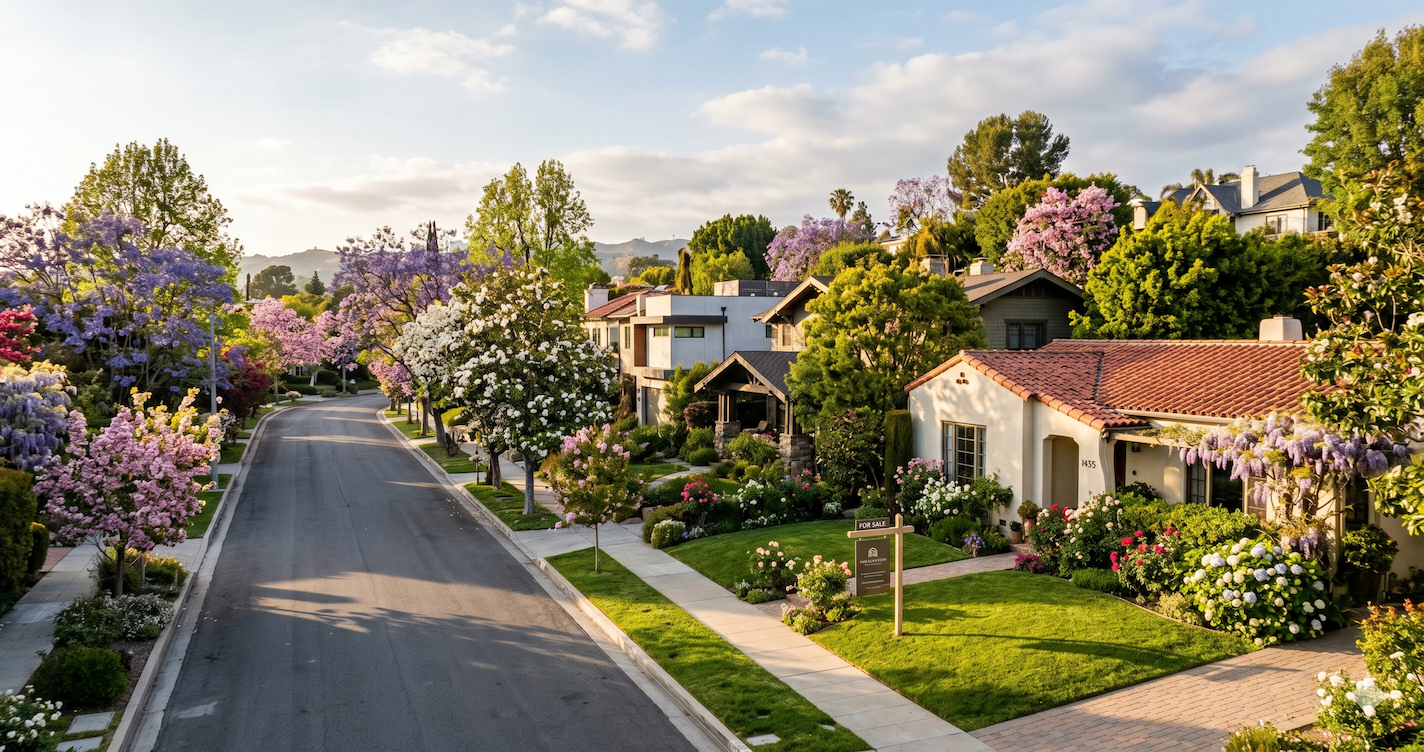
Spring is here — but the LA housing market is slowing down. Here's what that means for you.
More homes are hitting the market than buyers can absorb. If you're buying, selling, or just watching, this is the data you need to make a smart move right now.
April 14, 2026 · 4 min read · Data sourced from Reports on Housing — LA County
Spring is supposed to be the "hot" season in real estate. And in one sense, it is — closed sales are up, open houses are packed, and plenty of homes are moving. But there's a more nuanced story unfolding right now in Los Angeles County, and it's one that affects your decisions whether you're a buyer, seller, or sitting on the sidelines.
The bottom line: supply is rising faster than demand, and that's quietly shifting the balance of power in the market.
What "market time" actually tells you
Expected Market Time is the clearest snapshot of whether we're in a buyer's or seller's market. It measures how long it would take to sell every active listing at the current pace of buying. Right now, that number sits at 106 days — the highest it's been since January. For comparison, before the pandemic (2017–2019), it averaged just 58 days.
That said, context matters. At 106 days countywide, we're not in crash territory — we're in a normalizing market. And it's not uniform: detached homes are moving much faster (90 days) than condos and townhomes (146 days).
For sellers: what this means for your pricing strategy
More homes are competing for the same pool of buyers every week. That doesn't mean the market is bad — March saw 3,968 closed sales, up 7% from a year ago, and the countywide sales-to-list-price ratio was exactly 100%. Homes are still selling at asking price.
But precision matters more than it did a year ago. Overpriced homes are sitting. Well-priced, well-presented homes are still generating multiple offers and selling quickly. The gap between standout listings and mediocre ones is widening every week.
For buyers: more choices, better leverage
This is genuinely one of the better moments to be a buyer in the past couple of years. Inventory is the highest it's been since before COVID relative to demand, mortgage rates are lower than they were a year ago, and sellers are increasingly willing to negotiate — especially on homes that have been sitting.
That said, don't expect across-the-board discounts. Move-in ready, accurately priced homes in desirable areas are still flying. The opportunity is in homes that have been sitting 60+ days. Those sellers tend to be far more flexible.
Luxury market: economic uncertainty is setting in
The top of the market is slowing noticeably. Homes priced above $2 million are now sitting at an average of 217 days on market — with ultra-luxury ($8M+) at 870 days. Economic uncertainty appears to be causing high-net-worth buyers to pause and re-evaluate.
The bigger picture: watch the economy
Mortgage rates remain a wild card. The Federal Reserve is watching inflation closely, and upcoming economic data — including PPI, retail sales, and PMI — could push rates higher or lower. Any meaningful rate move in either direction will ripple into the housing market quickly.
On the distressed side, things look healthy: only 1.2% of active listings are foreclosures or short sales, and 98.9% of March's closed sales were by sellers with equity. This is not 2008.
Data sourced from Reports on Housing — Los Angeles County, April 13, 2026, written by Steven Thomas. All rights reserved by original author.
Check out this article next
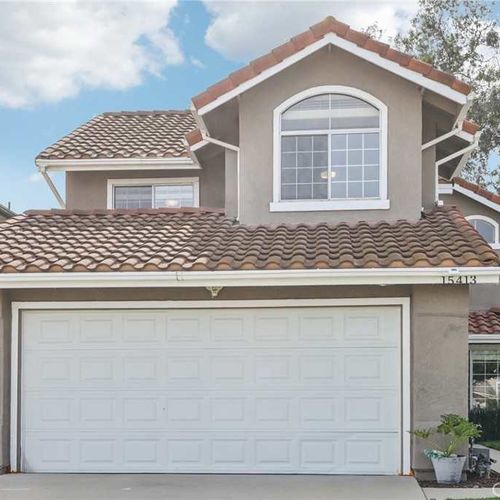
Is 15413 Oak Grove Court Your Dream Home?
Imagine driving up to a quiet cul‑de‑sac in Chino Hills and finding 15413 Oak Grove Court, a fully upgraded, move-in-ready house that checks nearly every…
Read Article