

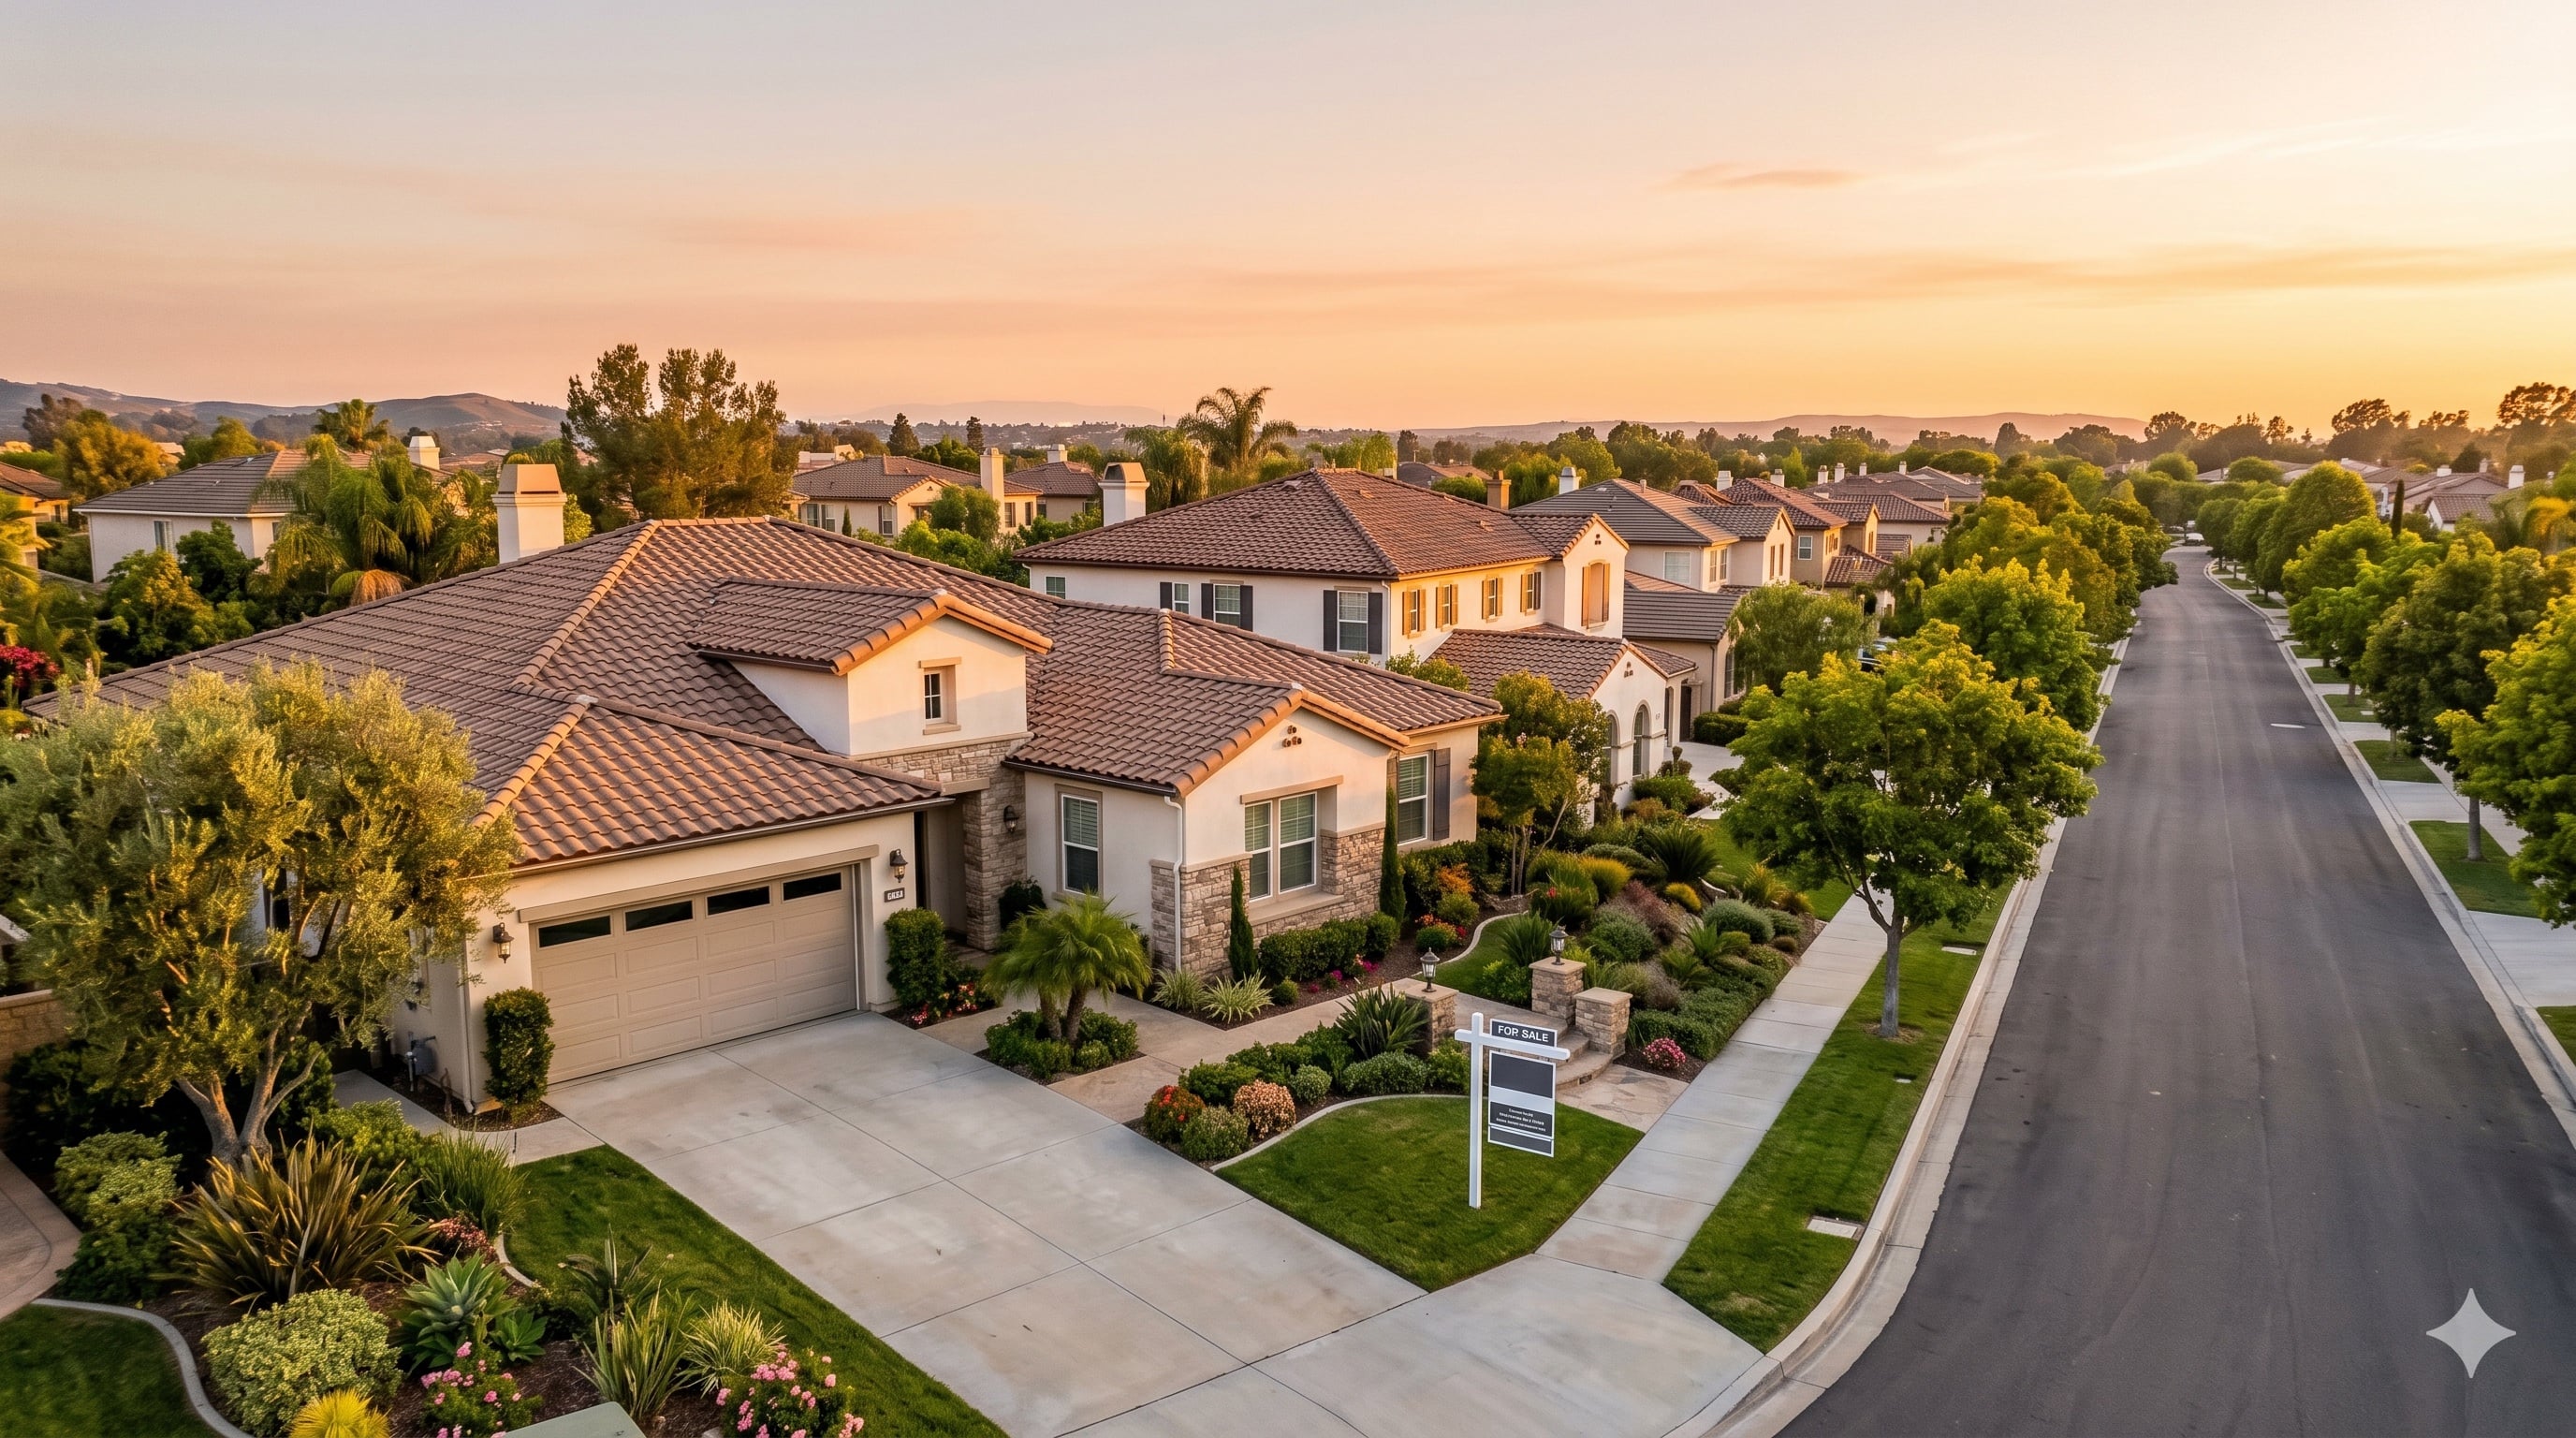
If the San Gabriel Valley market feels constrained — Orange County is even tighter.
The monthly payment on a median-priced Orange County home now takes up 71% of the average household’s monthly income. That is not a typo. Seven out of every ten dollars a typical OC household earns goes toward housing at today’s median price and rates.
That 71% is the highest affordability strain in modern Orange County history. It is 20 percentage points worse than the same metric in LA County. And it explains why OC buyer demand is 65% below pre-COVID levels while correctly priced homes in Brea, Yorba Linda, La Habra, Fullerton, Placentia, and Anaheim Hills are still selling in 10–13 days at full asking price.
This is the Orange County paradox of May 2026: the most unaffordable market in recent history — and one where well-positioned homes are moving faster than almost anywhere in Southern California.
May 2026 Market Summary — North Orange County
- Monthly payment = 71% of income — down from 75% in 2024, still at historic extremes
- Demand: 1,667 pending sales — flat since 2023, 65% below pre-COVID normal
- Active inventory: 4,475 — rising but still 42% below pre-COVID levels
- Expected market time: 81 days overall — significantly better than LA County’s 107 days
- Correctly priced homes sell fast: Placentia 10 days, Yorba Linda 11 days, Anaheim Hills 12 days — all at 100%
- No crash: Only 9 distressed homes in all of Orange County. 99.9% of April closings were sellers with equity
Data as of May 26, 2026. Licensed OC housing market research, CRMLS MLS, InfoSparks © 2026 ShowingTime Plus, LLC. Jack Ma | REALTOR® | DRE #01869426 | Century 21 Masters.
How Did Orange County Affordability Get to 71%?
| Year | Rate | Median Price | Median Income | Payment % of Income |
|---|---|---|---|---|
| 2012 | 3.66% | $543,000 | $72,000 | 33% |
| 2020 | 3.11% | $900,000 | $99,000 | 37% |
| 2022 | 5.33% | $1,235,000 | $106,047 | 62% |
| 2024 | 6.72% | $1,397,000 | $114,858 | 75% |
| 2026 | 6.51% | $1,470,000 | $126,631 | 71% |
Down from 75% in 2024 — but still historically extreme. Even the 2006 pre-crash peak in OC was only 63%. Path to relief: Rates at 6.0% → payment drops to 67%. Rates at 5.5% → payment drops to 63%.
Why Are OC Buyers Sitting on the Sideline?
Current OC demand: 1,667 pending sales — flat for three years. Pre-COVID average: 2,765 — that gap is 1,098 missing transactions every month in Orange County alone.
Today’s OC buyer is making the same three-part calculation as SGV buyers: price, rate, and job security. At a $1,470,000 median price with 6.5% rates and 20% down, the monthly payment is approximately $7,400. That requires approximately $265,000 in household income to stay within standard mortgage guidelines. That is a small, highly analytical, patient buyer pool — and they are not overpaying.
The OC Inventory Paradox — Why OC Moves Faster Than LA Despite Worse Affordability
Active listings: 4,475 — up 4%. But context matters:
- Last year: 4,595 — OC actually has fewer homes than a year ago
- Pre-COVID average (2017–2019): 6,370 — 42% more than today
Orange County has LESS inventory than normal. LA County has MORE. That structural difference explains why OC homes move faster (81 days) than LA County (107 days) despite far worse affordability. There simply are not enough homes to meet even the reduced demand.
What Is the Expected Market Time in Orange County?
OC overall: 81 days — significantly better than LA County’s 107 days.
| Property Type | Today | One Year Ago | Trend |
|---|---|---|---|
| Detached SFR | 76 days | 91 days | ✓ Improving |
| Condos/Townhomes | 87 days | 77 days | ⚠️ Worsening |
| All OC homes | 81 days | 85 days | ✓ Improving slightly |
Detached SFRs improving dramatically — 76 days vs. 91 last year. Close to pre-COVID average of 70 days. Condos deteriorating — 87 vs. 77 last year.
What Does the Market Look Like in Your North Orange County Cities?
| City | Market Time | Demand (30 days) | Active Listings | Median Active Price |
|---|---|---|---|---|
| Anaheim Hills | 42 days | 25 | 35 | $1.4M |
| Fullerton | 45 days | 75 | 113 | $988K |
| Placentia | 52 days | 29 | 50 | $950K |
| Brea | 56 days | 21 | 39 | $1.3M |
| Yorba Linda | 86 days | 43 | 123 | $1.5M |
| La Habra | 115 days | 18 | 69 | $850K |
Anaheim Hills, Fullerton, and Placentia are the strongest markets in this group — all well below the OC average of 81 days. Fullerton’s demand of 75 pending sales against 113 actives is the most active ratio here.
Brea at 56 days is healthy. North OC’s most walkable city with realistic pricing.
Yorba Linda at 86 days is near the OC average. At $1.5M median active, affordability pressure is real — but the sold data tells a very different story.
La Habra at 115 days is above both OC and LA County averages. With only 18 pending sales against 69 actives, supply is outpacing demand. The issue is not necessarily overpricing — it is a supply-demand imbalance at the $800K–$850K price range.
What Are Homes Actually Selling For in North Orange County?
The sold data reveals something striking: nearly every city is closing at exactly 100% of list price. The buyers who are purchasing are paying full price — because the homes they are buying are correctly priced.
| City | Median Sold | Sale/List | Median DOM | $/SqFt |
|---|---|---|---|---|
| Placentia | $1,187,500 | 100.1% | 10 days | $655 |
| Yorba Linda | $1,277,500 | 100.0% | 11 days | $687 |
| Anaheim Hills | $1,129,500 | 100.0% | 12 days | $586 |
| Brea | $1,160,000 | 100.0% | 13 days | $586 |
| Fullerton | $965,000 | 99.5% | 19 days | $611 |
| La Habra | $799,995 | 100.0% | 16 days | $553 |
The active vs. sold gap:
| City | Active Median | Sold Median | Gap |
|---|---|---|---|
| Yorba Linda | $1,500,000 | $1,277,500 | +$222,500 |
| Brea | $1,300,000 | $1,160,000 | +$140,000 |
| La Habra | $850,000 | $799,995 | +$50,000 |
The OC active vs. sold gap is smaller than in LA County — OC sellers are pricing closer to market reality. But the gap still exists, and it still determines which homes sell in 10 days and which sit for 90.
Two Markets — OC Edition
✓ Market 1 — Correctly Priced, Good Condition, Good Location
Placentia: 10 days at 100.1%. Yorba Linda: 11 days at 100.0%. Anaheim Hills: 12 days at 100.0%. Brea: 13 days at 100.0%. These homes are being absorbed immediately by a selective but motivated buyer pool.
⚠️ Market 2 — Overpriced or Carrying a Flaw
Sitting 60–90+ days. Homes priced above the sold market. Homes with condition issues. Homes in less desirable locations. The OC buyer making a 71%-of-income payment decision is extraordinarily disciplined. They know exactly where homes are closing — and they are not paying above it.
Is There a Crash Coming in Orange County?
One remarkable number: 0.2%.
That is the share of OC listings that are distressed. The entire county has 3 foreclosures and 6 short sales on the active market. Nine total distressed homes. 99.9% of April 2026 closings were sellers with equity.
No foreclosure wave. No distressed flood. If you are waiting for a crash in Brea, Yorba Linda, or La Habra — the data says it is not coming.
What Does This Mean If You Are Thinking About Selling in North Orange County?
The OC market rewards correctly priced homes with extraordinary speed. Ten to thirteen days to pending in Placentia, Yorba Linda, and Anaheim Hills. The buyer who comes to your home in OC is financially sophisticated, pre-approved, and has done their research. They know what sold comps look like. They are not paying the active list premium.
Price to the sold market — not the active market. A Yorba Linda seller pricing to the $1,500,000 active median when homes are closing at $1,277,500 is waiting for a buyer who is not coming at that price.
Want to know what your home would net at current sold values? A free net proceeds analysis is available.
What Does This Mean If You Are Thinking About Buying in North Orange County?
At 71% of income, OC homeownership requires unusual financial strength or significant equity — or both. But for buyers who ARE financially positioned, the OC market offers something valuable: a highly selective buyer pool means less competition than you would expect at these price points.
The correctly priced homes in Placentia, Brea, and Anaheim Hills go in two weeks. Speed and preparation are the only competitive advantages. The homes sitting at 86+ days in Yorba Linda and La Habra represent real negotiating opportunity — a seller on market for 60+ days is a very different conversation.
For the San Gabriel Valley market update covering Diamond Bar, Walnut, Chino Hills, Rowland Heights, and Hacienda Heights, see our companion report: LA County Housing Market Update — May 2026.
Free — No Obligation — North Orange County Specific
Talk Through What This Means for Your Home
Whether buying, selling, or trying to understand Brea, Yorba Linda, La Habra, or surrounding North OC cities — a 15-minute conversation with a local specialist who works with this data every day is the most useful thing you can do.
📅 Book a Free 15-Min Call
📞 909.610.5188
Jack Ma | REALTOR® | DRE #01869426 | Century 21 Masters | Brea · Yorba Linda · La Habra · Fullerton · Placentia · Anaheim Hills
The Bottom Line
Orange County in May 2026 is the highest-affordability-pressure market in this area’s recent history — and one of the fastest markets for correctly priced single-family homes. Those two facts coexist because supply is structurally constrained. There are 42% fewer homes than pre-COVID normal. In a market with 65% fewer buyers than normal but 42% less supply, the best homes still sell fast.
Strategy matters more than timing. Pricing matters more than hope. And in a market where the monthly payment requires this level of financial commitment — understanding what today’s buyer is actually willing to pay is the most valuable thing any seller can know.
🏠 What Is Your North Orange County Home Worth Right Now?
Free home valuation based on current sold comparables — not active list prices.
Related Reading
About Jack Ma — REALTOR® | DRE #01869426
Jack Ma is a licensed Broker Associate with Century 21 Masters (DRE #01869426) with 15+ years serving the tri-county border area of LA, Orange, and San Bernardino County. Specializing in Brea, Yorba Linda, La Habra, Fullerton, Placentia, Diamond Bar, Walnut, and Chino Hills. 300+ homes sold. 101.9% list-to-sold ratio in 2026. Bilingual English and Mandarin. 909.610.5188
Frequently Asked Questions
What is the Orange County housing market like in 2026?
Monthly payment = 71% of median income. Demand 65% below pre-COVID. But correctly priced SFRs are selling in 10–13 days at 100% of list. No crash — 0.2% distressed listings. 99.9% of April closings were sellers with equity.
What is the market like in Yorba Linda in 2026?
86-day market time. Median sold $1,277,500 at 100.0% in 11 days. Active median $1,500,000 — a $222,500 gap. Correctly priced homes move fast. Overpriced listings sit.
What is the market like in Brea CA in 2026?
56-day market time — below OC average of 81 days. Median sold $1,160,000 at 100.0% in 13 days. Active median $1,300,000. One of the stronger markets in North OC right now.
How does OC compare to LA County for real estate in 2026?
OC is more expensive (71% vs. 51% payment-to-income) but paradoxically faster (81 vs. 107 days). OC has 42% less inventory than pre-COVID norms, creating supply scarcity that keeps correctly priced homes moving despite worse affordability.
Is there a crash coming in Orange County in 2026?
No. Only 9 distressed homes in all of OC. 99.9% of April closings were sellers with equity. No foreclosure wave. No distressed flood. The market is affordability-constrained — not collapsing.
Market data as of May 26, 2026. Sources: Licensed OC housing market research, CRMLS MLS, InfoSparks © 2026 ShowingTime Plus, LLC. Jack Ma | REALTOR® | DRE #01869426 | Century 21 Masters.