- Not a crash: 99%+ of LA & OC sellers have equity. Distressed sales are just 1.3% (LA) and 0.3% (OC) of listings.
- Sale-to-list ratio: 100% in both counties — homes are still closing at asking price.
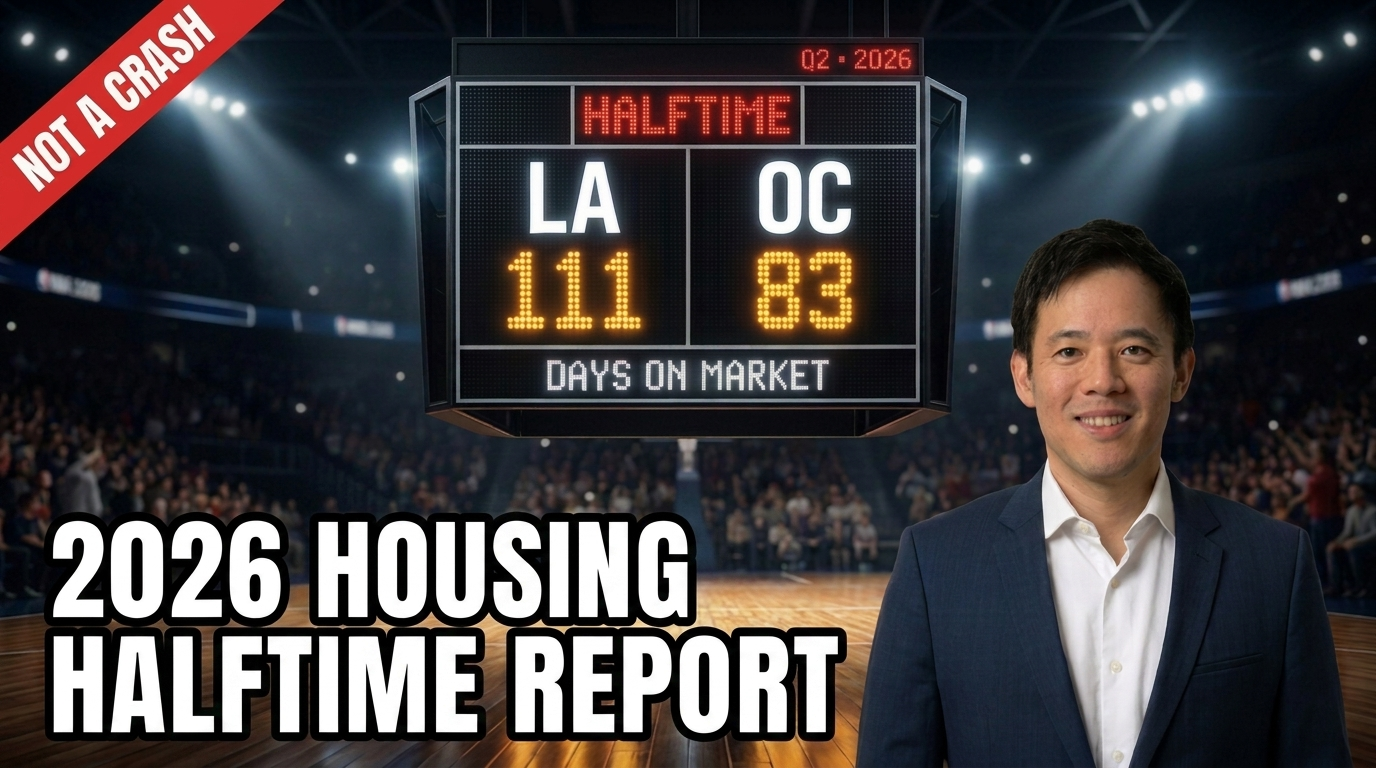
- OC moving faster than LA: Expected market time is 83 days in Orange County vs. 111 days in Los Angeles County.
- Detached homes outperforming condos: Houses are selling meaningfully faster than condos & townhomes in both counties.
- Mortgage rates are the gas pedal: Rates touched the high 5s in February, climbed back to 6.68% after the Iran conflict spiked inflation fears.
- Record delisted homes: 12,107 sellers pulled homes off the LA County market through May, +15% year-over-year — strong signal most sellers don’t have to sell.
Data as of June 8, 2026. Sourced from the latest local market data covering Los Angeles & Orange County housing activity.
The NBA Finals just wrapped up. But there’s another game still being played — the 2026 housing market — and we’re only at halftime.
So let me do what every good halftime show does. Recap the first half. Tell you which team is actually winning. And show you what to watch in the second half.
I’m Jack Ma with Century 21 Masters. Quick note up front — I’m a REALTOR®, not a financial advisor. This is local market data, not investment advice. For anything beyond housing, talk to your CPA and your financial planner.
If you’d rather watch the 90-second video version of this halftime report, scroll down to the embedded video or head to my YouTube channel. Otherwise, let’s get into the scoreboard.
Is the 2026 housing market crashing? The number that ends that conversation.
Here’s the gut-check for anyone scared the housing market is about to crash like 2008. In Los Angeles and Orange County right now, over 99% of current home sellers have equity. Distressed sales — foreclosures and short sales — are barely 1% of the market. And homes are still closing right at their asking price. The sale-to-list ratio is sitting at 100% in both counties.
A crash is forced selling and collapsing prices. This is the opposite. What we actually have isn’t a crash. It’s a slow market. Those are very different things — and confusing them costs people money.
If you want the deeper version of why higher rates and persistent inflation are actually keeping Southern California prices up rather than dragging them down, I broke that down in this companion post on the housing market and inflation.
- LA County: 180 distressed homes on the active market out of 14,290 total (1.3%). 99.3% of April closings were sellers with equity.
- Orange County: 12 distressed homes on the active market out of 4,551 total (0.3%). 99.9% of April closings were sellers with equity.
- Sale-to-list ratio: 100% in both counties.
Why mortgage rates are the gas pedal of the 2026 housing market
If you want to understand the 2026 housing market in one idea, it’s this. Mortgage rates are the gas pedal.
Back in February, rates were a hair under 6% — about to drop into the 5s for the first time since August 2022. Buyers were ready to pour in. Then the Iran conflict spiked fuel prices and inflation fears. Rates climbed right back up. Today they’re around 6.68%.
That’s the whole story of why the market feels stuck. It’s not that nobody wants to buy. It’s that affordability got pushed back the moment rates crossed back over 6.5%.
Watch the rate. When it falls and stays down, this market wakes up fast.
Why buyers are still cautious — three real concerns
Active list prices in many ZIPs are running well above where homes actually close. Buyers see the gap and won’t bridge it for the seller.
At 6.68%, the monthly payment on a $1.2M home with 20% down lands near $6,000/month before taxes and insurance. That’s the math buyers are running.
Economic uncertainty makes buyers cautious about taking on a 30-year commitment unless the home is exactly right and the price reflects today’s market.
Halftime scoreboard: Orange County is selling faster than Los Angeles
Here’s the scoreboard surprise. At halftime in 2026, Orange County is selling faster than Los Angeles. The expected market time — basically how long it would take to sell every listing at today’s pace — is about 83 days in Orange County versus 111 days in LA County.
And in both counties, detached single-family homes are moving a lot faster than condos and townhomes.
| Property Type | LA County — Market Time | Orange County — Market Time |
|---|---|---|
| Detached single-family | 96 days | 76 days |
| Condos & townhomes | 151 days | 94 days |
| All homes combined | 111 days | 83 days |
So “the market” isn’t one thing. Your price range, your city, and whether it’s a house or a condo matter way more than any national headline. Real estate is local — and right now, it’s local down to the street.
The most important play of the first half: record delisted homes
Here’s the play almost nobody’s talking about. A record number of sellers are pulling their homes off the market instead of cutting the price.
In LA County alone, more than 12,000 sellers have delisted this year — up 15% over last year, the highest level since the Great Recession. In Orange County, nearly 3,000 sellers have done the same, also up double digits year-over-year and the highest level since 2020.
Two takeaways from this.
One — most sellers don’t have to sell. If they did, they’d cut the price to get the sale. Pulling the listing off the market is a luxury only available to homeowners who can afford to wait. That’s exactly why there’s no crash brewing.
Two — in this market, pricing is the entire game. Price it right and it still sells in weeks. Price it on hope, and you become one of those 12,000 homes that just sat there. The market is rewarding realism and punishing wishful thinking.
The two markets inside one market: who’s winning, who’s stuck
The cleanest way to understand 2026 isn’t to talk about “the market” as one thing. It’s to recognize that there are actually two markets running side-by-side right now — and they have completely different rules.
Correctly priced, good condition, good location
Selling in 10 to 26 days at or very near asking price. The well-prepared homes are moving fast, even at higher rates. In April 2026: Brea homes sold in 13 days, Yorba Linda in 11, West Covina in 12, Anaheim Hills in 12 — at 100% of list price.
Overpriced or carrying a flaw
Sitting 60 to 90+ days, often chasing the market down with price cuts. Common flaws: priced on hope rather than comps, freeway noise, major renovation needed, awkward floor plan, or a significant price-to-value gap.
Which market your home is in is mostly about decisions you control — pricing, prep, and presentation. If you’d like to think through which side your specific home would land on, that’s exactly the kind of question I’d want to walk through with you on a 15-minute call before you list.
Your local cities — the halftime numbers
Here’s how the cities in my primary service area actually performed for closed April 2026 sales. These are the homes that did sell — the ones that made it through to escrow.
| City | County | Units Sold | Median Sale Price | Median DOM | SP/LP Ratio |
|---|---|---|---|---|---|
| Brea | Orange | 23 | $1,160,000 | 13 | 100.0% |
| Yorba Linda | Orange | 60 | $1,277,500 | 11 | 100.0% |
| Placentia | Orange | 26 | $1,187,500 | 10 | 100.1% |
| Anaheim Hills | Orange | 20 | $1,129,500 | 12 | 100.0% |
| Fullerton | Orange | 65 | $965,000 | 19 | 99.5% |
| La Habra | Orange | 34 | $799,995 | 16 | 100.0% |
| Diamond Bar | Los Angeles | 27 | $1,080,000 | 26 | 99.5% |
| Walnut | Los Angeles | 20 | $1,300,000 | 11 | 98.5% |
| Rowland Heights | Los Angeles | 9 | $955,000 | 45 | 97.6% |
| Hacienda Heights | Los Angeles | 30 | $1,077,500 | 19 | 100.0% |
| West Covina | Los Angeles | 50 | $813,500 | 12 | 100.1% |
| Covina | Los Angeles | 33 | $788,000 | 12 | 100.0% |
| Chino Hills | San Bernardino | See full Chino Hills market data on the Chino Hills community page. | |||
Source: closed April 2026 single-family resales. DOM = median days on market. SP/LP = sale-to-list price ratio. A figure of 100% means homes closed at exactly the asking price; figures above 100% indicate over-asking offers on closed homes; figures below 100% indicate price negotiation.
The hidden story: actives vs. solds — the pricing gap
The April sold numbers above are the winners. The bigger story is the gap between those winners and the homes currently sitting on the market. Active median list prices are running well above where homes actually close — and the active market time tells you which cities have the widest pricing gap.
| City | Active Median List | Active Market Time | Sold Median (Apr) | Read |
|---|---|---|---|---|
| Walnut | $1.5M | 225 days | $1.3M | Wide gap. Active inventory is sitting; well-priced homes are flying (11 DOM). |
| Yorba Linda | $1.5M | 78 days | $1.28M | Healthy. Sold prices close to list — Market 1 is dominant. |
| Brea | $1.3M | 44 days | $1.16M | Tightest market in your area. Buyer demand is real. |
| Diamond Bar | $1.2M | 117 days | $1.08M | School-district premium intact, but slower than OC neighbors. |
| West Covina | $800K | 78 days | $813K | Best alignment of any LA-side city — actives priced near solds. |
| Anaheim Hills | $1.1M | 33 days | $1.13M | The fastest market on this list. Sellers in the driver’s seat here. |
The widest gap on this list is Walnut — and that’s worth pausing on. Walnut Valley Unified is one of the strongest school districts in the area, which is exactly why some sellers price aggressively. But the data shows what actually happens: the well-priced Walnut homes sold in 11 days at 98.5% of list. The overpriced Walnut inventory is sitting for an expected 225 days. Same city. Two completely different outcomes. Pricing is the entire game.
What the 2026 halftime scoreboard means for you specifically
If you’re buying — you finally have time and leverage
Less competition. Room to negotiate. Homes that sit are negotiable on price, repairs, and closing costs. The buyers who win in this market are the ones who study the actual sold comps, ignore the active list prices, and write strong offers on homes that have sat past 30 days.
If you’re worried about whether buying now versus waiting for rates to drop is the right call, I broke that argument down in this companion post on rates, inflation, and the cost of waiting.
If you’re selling — buyers are real, but picky
Price it right out of the gate and your home still sells fast. Overprice it and you’ll chase the market down for months — and risk becoming one of the 12,000+ delisted homes this year. The first 14 days on the market matter more than ever; that’s when serious buyers are looking, and that’s when your strongest offers come in.
Before you list, the smartest first move is understanding your real net proceeds after commission, prep costs, repairs, and closing — not just the list price. Run a free net proceeds analysis here.
If you’re just watching — keep your eye on mortgage rates
Because the day rates fall and stay down is the day this slow market turns. When that happens, the buyers who waited will come back fast — and the leverage you have today disappears overnight.
Free — No Pressure, No Pitch
Want a Real Read on Your Specific Home?
Book a free 15-minute call. I’ll pull live comps for your specific block, show you where your home sits today versus six months ago, and tell you what’s actually selling — what’s sitting — and what that means for your timing. Just data and strategy.
Jack Ma | REALTOR® | DRE #01869426 | Century 21 Masters
West Covina · Walnut · Rowland Heights · Diamond Bar · Chino Hills · Brea · Yorba Linda · La Habra
The bottom line at halftime
The buyers are still here. The sellers are still in control. But only the homes priced right are winning.
The market isn’t crashing — 99% of sellers have equity and homes are still closing at 100% of list. It also isn’t on fire — overall market time is 111 days in LA and 83 in OC, and a record number of sellers are pulling listings rather than cutting price.
What’s happening is a market that’s rewarding realism and punishing wishful thinking, with mortgage rates as the gas pedal that decides how fast the second half goes. Whatever side of this market you’re on — buying, selling, or just watching — the right move starts with knowing exactly where your specific home or neighborhood actually sits, not where the national headlines say it should.
About Jack Ma — REALTOR® | DRE #01869426
Jack Ma is a licensed Broker Associate with Century 21 Masters (DRE #01869426) with 15+ years serving the tri-county border area of Los Angeles, Orange, and San Bernardino County. 300+ homes sold. 101.9% list-to-sold ratio in 2026. Specializing in West Covina, Diamond Bar, Walnut, Chino Hills, Brea, Yorba Linda, Rowland Heights, and La Habra. Bilingual English and Mandarin. 909.610.5188 | [email protected]
Related Reading
- Is the Housing Market Crashing? Why Inflation Is Keeping San Gabriel Valley Prices Up in 2026
- Los Angeles County Housing Market Update — May 2026
- 3 Reasons Your San Gabriel Valley Home Isn’t Selling
- Free Net Proceeds Analysis
- West Covina Community Guide
- Diamond Bar Community Guide
- Walnut Community Guide
- Brea Community Guide
- Chino Hills Community Guide
Frequently Asked Questions — 2026 Halftime Housing Market
Is the 2026 housing market crashing in LA and Orange County?
No. Over 99% of sellers in both counties have equity. Distressed sales make up 1.3% of LA listings and 0.3% of OC listings. Homes are still closing at 100% of list price. This is a slow market, not a crash.
How long does it take to sell a home in LA vs OC right now?
Expected market time is 111 days in LA County and 83 days in Orange County. Detached homes are moving meaningfully faster than condos in both counties. Well-priced homes still sell in 10–26 days.
Why are mortgage rates so important right now?
Mortgage rates are the gas pedal for the housing market. Rates touched the high 5s in February, climbed back to 6.68% after the Iran conflict spiked inflation fears. When rates drop below 6.5% with duration, demand picks up fast.
Why are so many sellers pulling homes off the market?
Through May 2026, 12,107 sellers in LA County and 2,939 in OC delisted — both at multi-year highs. This signals that most sellers don’t have to sell and won’t cut price below their floor. It also means pricing strategy at launch matters more than ever.
What does this market mean for buyers?
Buyers have time and leverage. Less competition, more room to negotiate on price and terms, especially on homes that have sat past 30 days. The buyers who win study the actual sold comps, not the active list prices.
What does this market mean for sellers?
Buyers are real but picky. Price it right out of the gate and your home sells in 10–26 days at or near list. Overprice it and you chase the market down. The first 14 days on the market matter more than ever.
How are cities like Brea, Yorba Linda, Diamond Bar, and Walnut performing?
In April 2026, Brea sold in a median of 13 days at 100% of list, Yorba Linda in 11 days at 100%, Anaheim Hills in 12 days at 100%, West Covina in 12 at 100.1%, and Walnut in 11 days at 98.5%. Active market time tells a different story — Walnut’s overall active time is 225 days because of overpriced unsold inventory. Same city, two different outcomes.
Disclaimer: This article is for general informational purposes only and reflects local housing market data as of June 8, 2026. Market conditions change. Jack Ma is a licensed California real estate broker associate (DRE #01869426), not a CPA, tax attorney, lender, or financial advisor. Real estate decisions should be made in consultation with qualified professionals based on your specific circumstances. Past market patterns do not guarantee future performance. All city-level sold figures reflect closed April 2026 single-family residential resales from California Regional MLS. Property listed by Century 21 Masters, Chieh-Jen (Jack) Ma. Equal Housing Opportunity.